
Provisioning
Orchestrate many concurrent application onboardings to your enterprise customer identity service
Onboarding new applications can be a complex process, especially when there are multiple applications to onboard. That's why we've created the Onboarding Dashboard - a tool that provides a holistic view of the onboarding activities of applications within your enterprise.
Onboarding Dashboard works with ProjectsNext Identity Projects enables service administrators to create onboarding projects for each application, provision properties and clients that meet their integration requirements, and take them through a customizable onboarding workflow.
Our Onboarding Dashboard is designed to simplify the onboarding process by providing better visibility over onboarding projects. With this tool, you'll clearly understand the status of each application's onboarding process, reducing confusion and saving time.
The Onboarding Dashboard allows for proactive monitoring of the onboarding process, which reduces the time it takes to onboard an application. With the dashboard, you'll be able to identify bottlenecks in the process and take steps to address them before they become a problem, saving you time and resources.
One of the key benefits of the Onboarding Dashboard is that it helps with capacity planning and bandwidth management for your applications. By providing information on the stages of the application onboarding projects and how long each project is taking, you'll be able to allocate resources more effectively, which ensures that you have the right resources available at the right time, preventing delays in the onboarding process.
The Onboarding Dashboard is user-friendly and gives you all the information you need at your fingertips.
Let’s walkthrough the different parts you’ll see in this new tool.
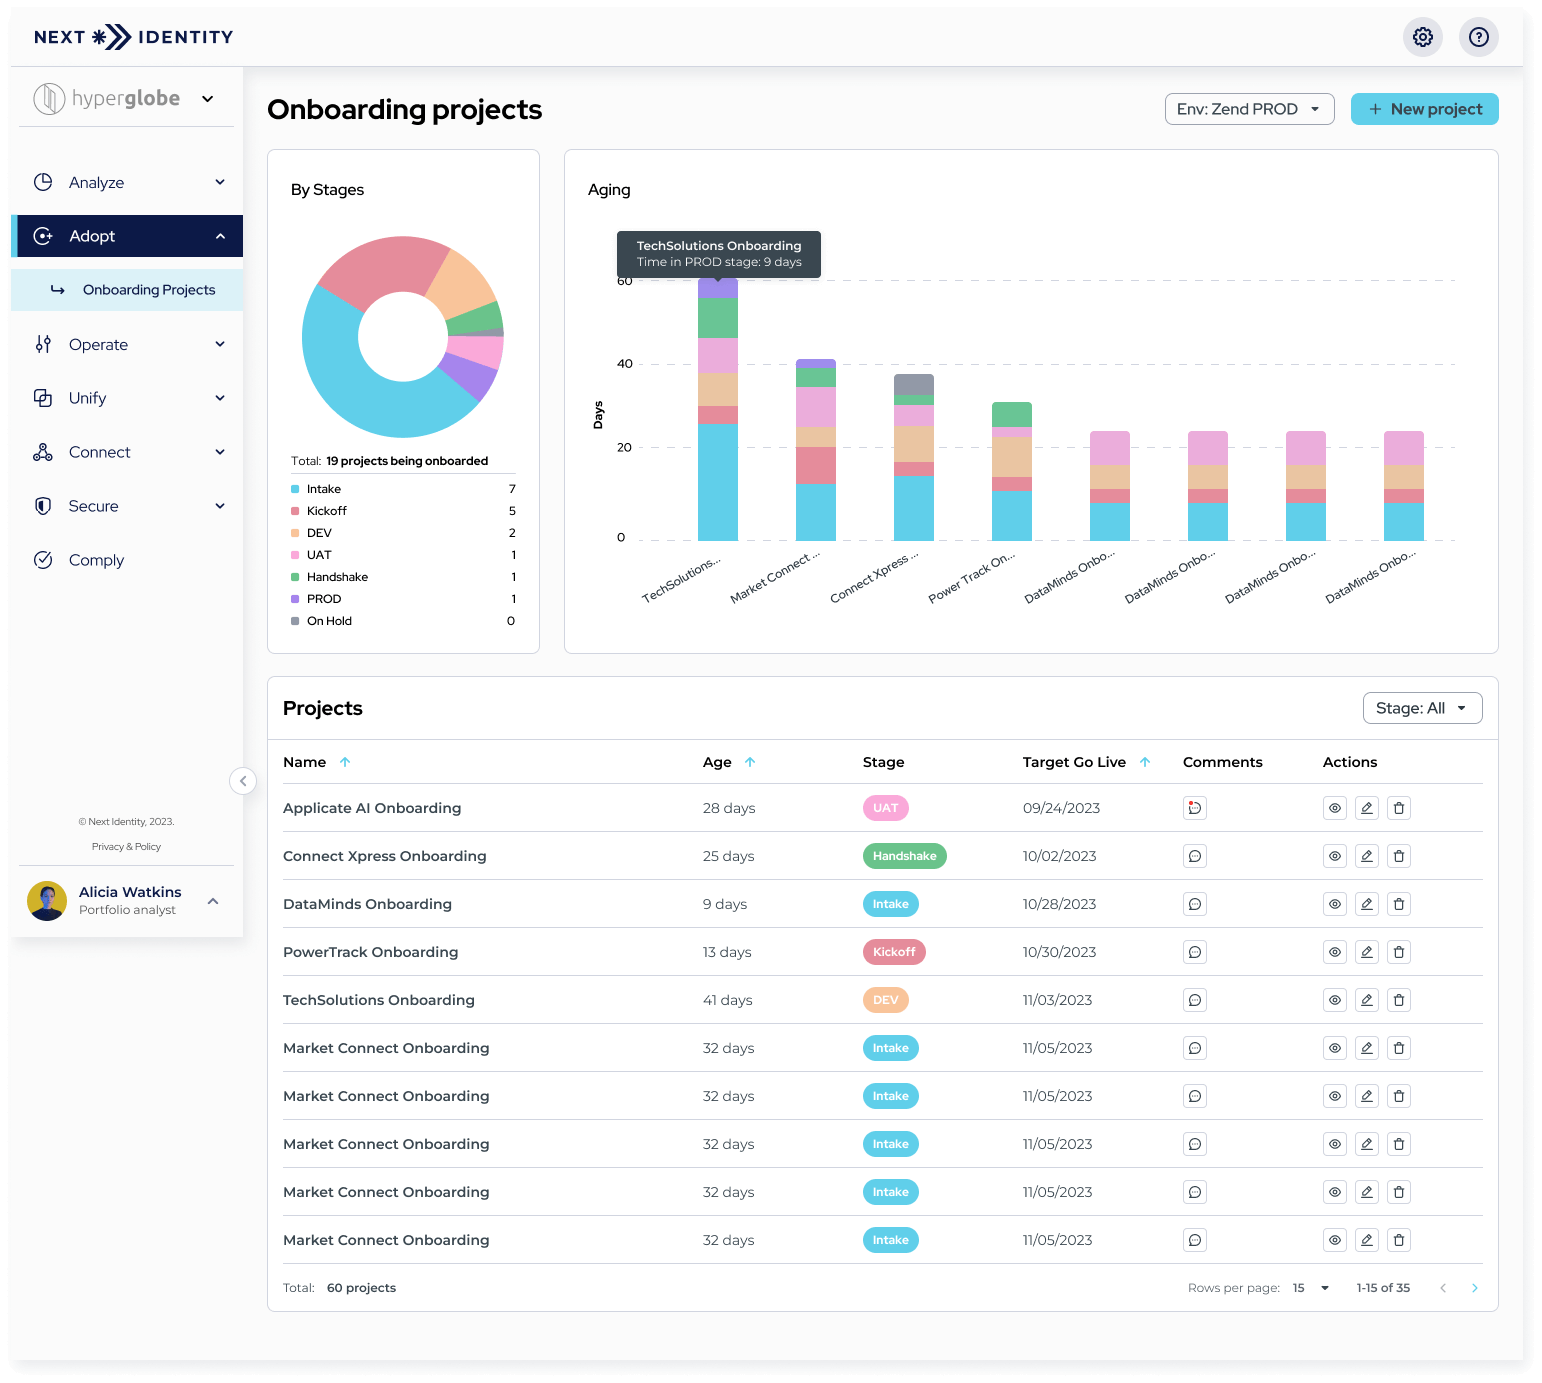
Onboarding Dashboard
By Stages
The By Stages chart provides an overview of how many properties are being onboarded and the stage of their onboarding projects.
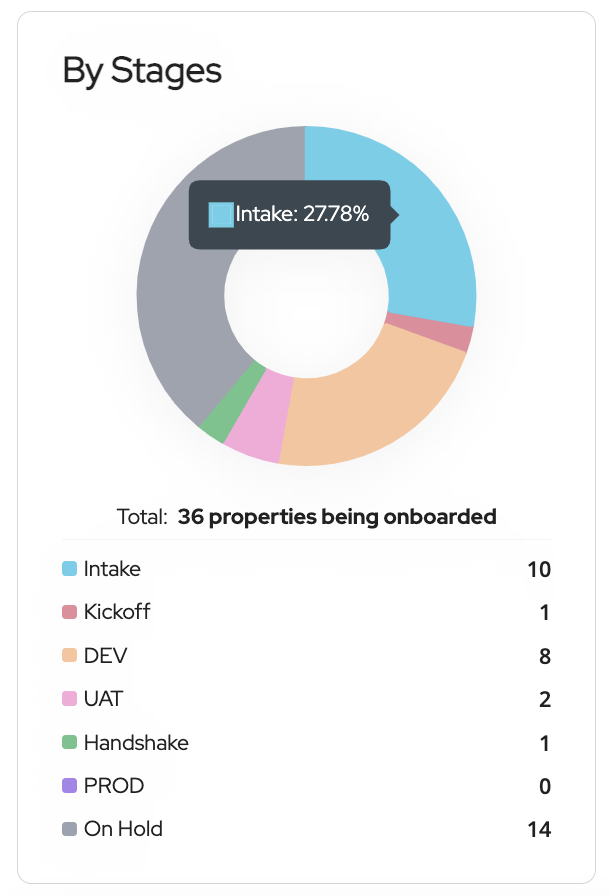
The By Stages Chart
Aging Chart
The Aging Chart displays the duration of each onboarding stage using a specific color to represent each stage. You can hover over a segment to see the time the project stayed in that stage.
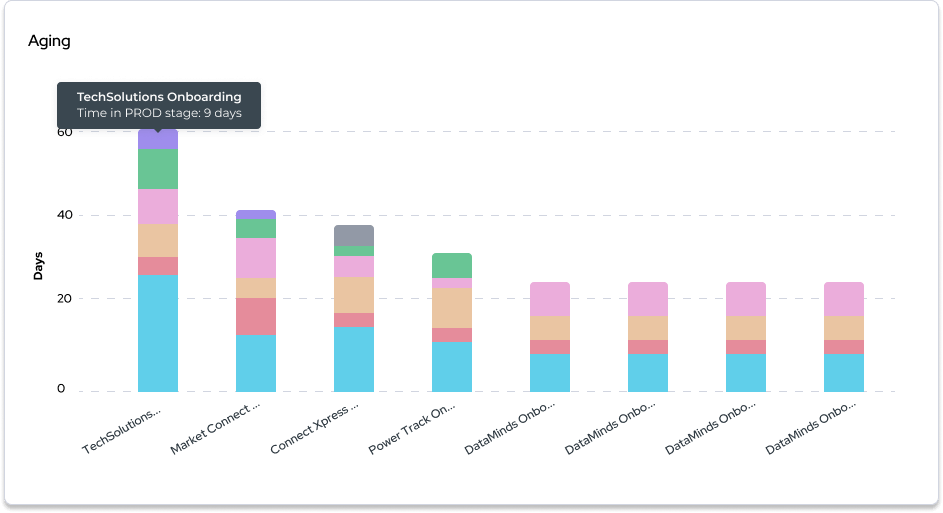
Aging Chart
Projects List
The Projects List provides an overview of all the projects onboarding and their related information.
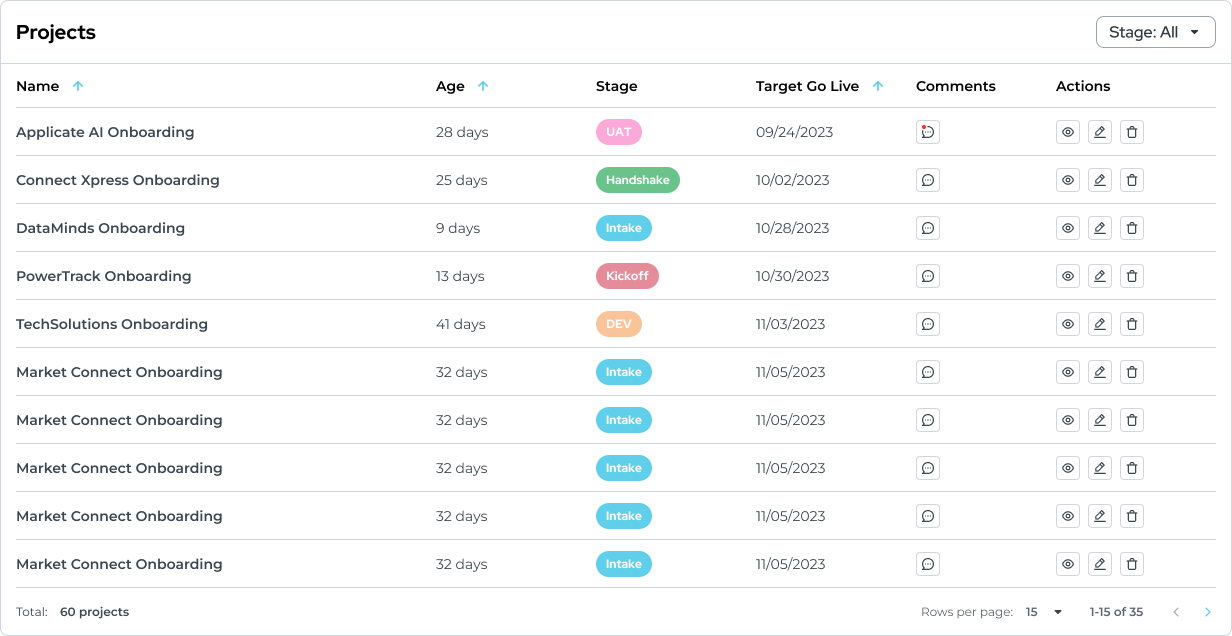
Projects List
To filter the projects by their current stage, use the Stage filter at the upper left corner of the table.
To view project details, click on the project name. Details include description, status, technical notes, and history.
To view the latest comments for a project, hover over the comments icon. A tooltip will show the last three comments added.

Comments icon
Updated 9 months ago