
Engagement Insights
Explore user engagement insights with Next Identity Analyze
On the Engagement page of Next Identity Analyze, you can access vital identity analytics. To find the Engagement page, navigate to Analyze in the left menu.
Key Metrics & Charts
This page showcases diverse user activities within your organization. It comprises several segments such as Total registrations, activations, logins, drop-offs, and API Endpoint Tracking that monitor system interactions. Analyzing these aspects gives you a holistic comprehension of user behavior. Consequently, this knowledge can guide you in making informed decisions to enhance user experience and efficiency.
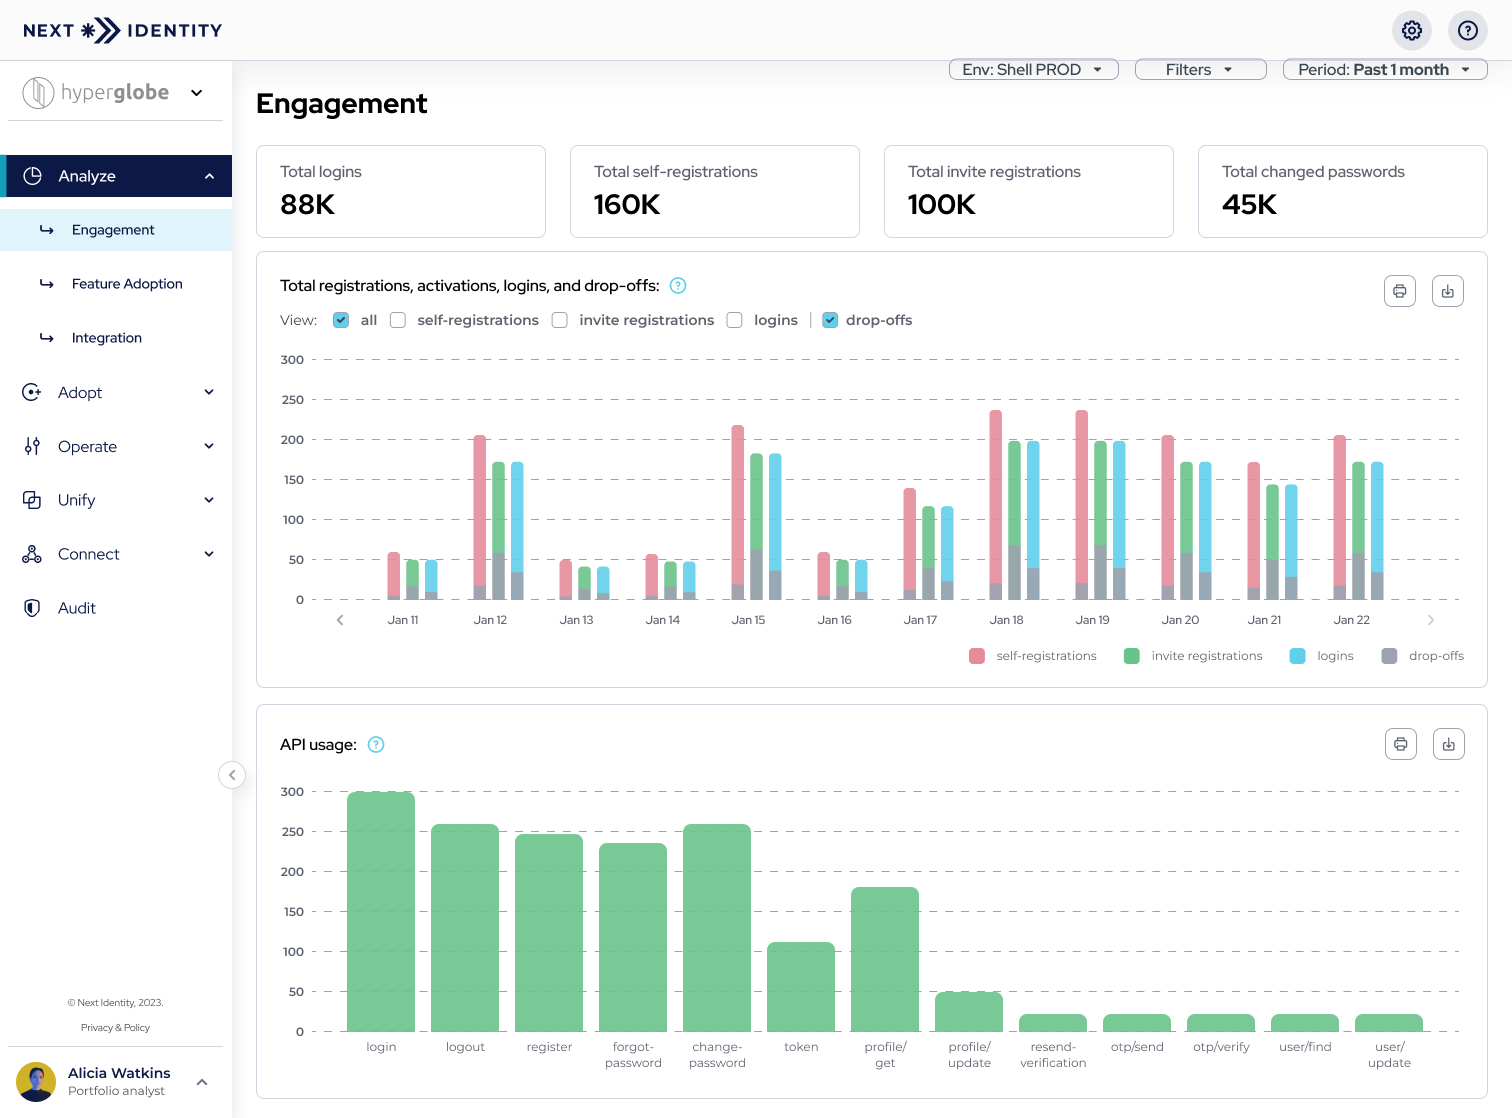
Overview on Next Identity Analyze - Engagement Page
Key Metrics
In the Totals section, you can get a quick overview of the total number of logins, registrations, activations, and password resets for your organization in the selected environment. Learn more about the filters for this page.

Overview of Total registrations, activations, logins, and drop-offs.
Total registrations, activations, logins, and drop-offs
This chart shows the total number of registrations, activations, logins, and drop-offs during the selected time period (Learn more about the filters for this page). Hover over a bar to show the total counts for the selected section (registrations, activations, logins, or drop-offs).
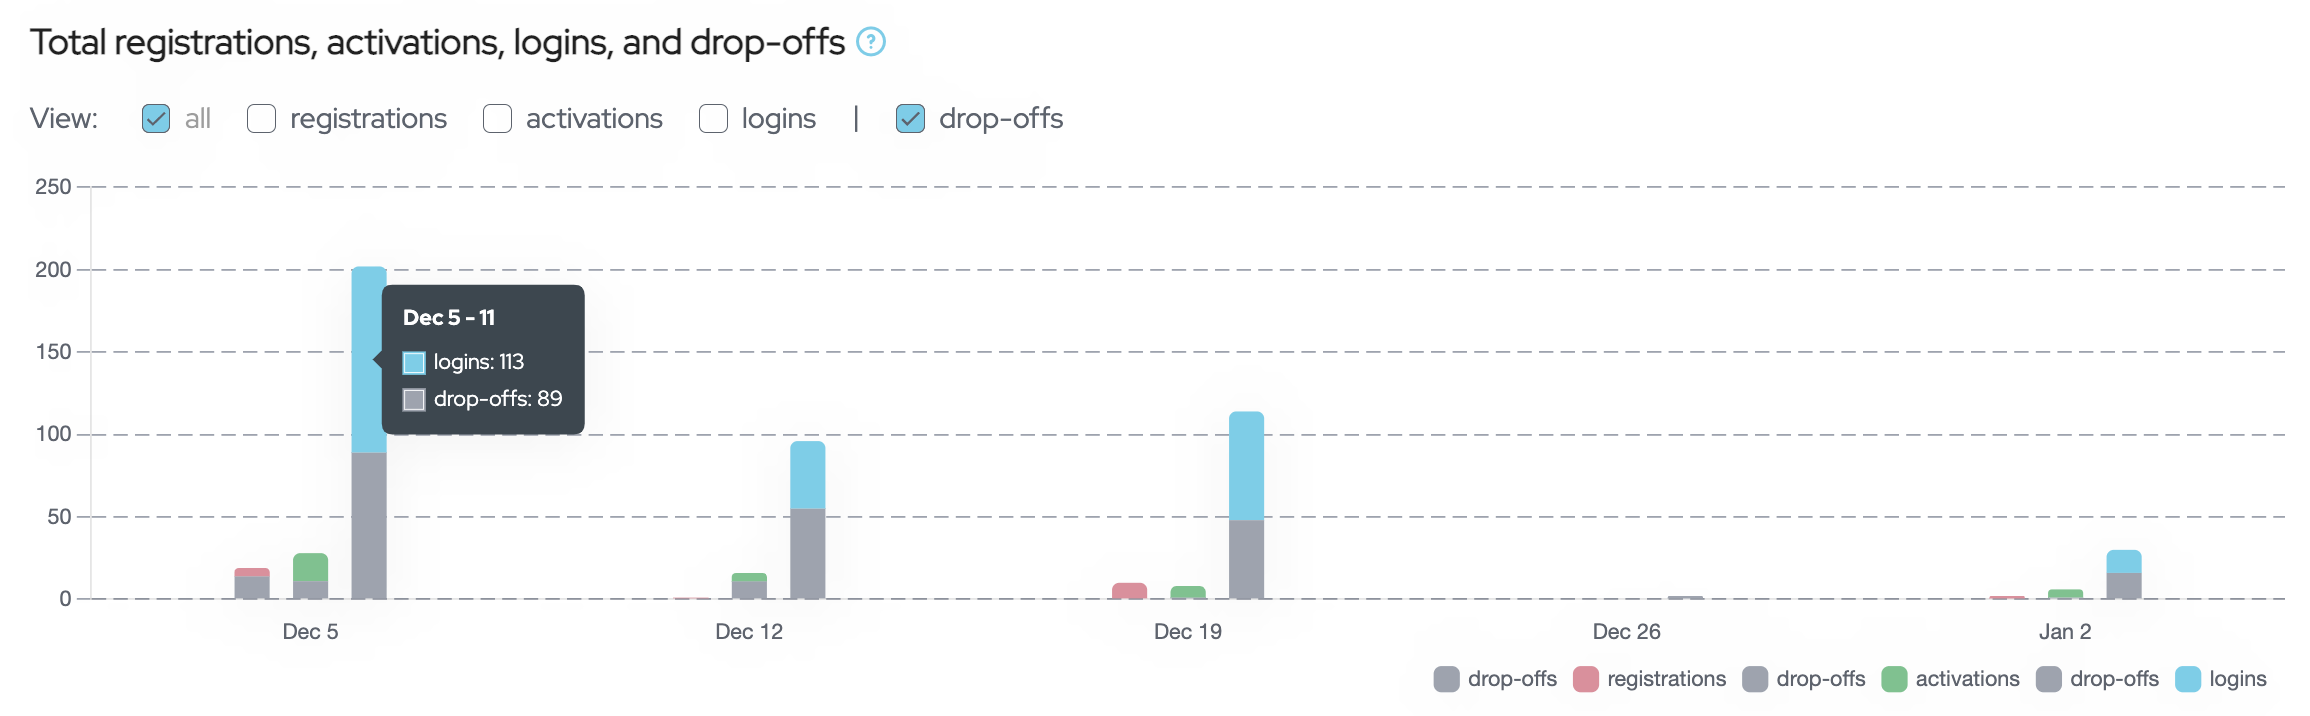
The Total registrations, activations, logins, and drop-offs graph.
The chart shows the following information:
- Registrations: The number of times the register-success page or insert-pin page was rendered.
- Activations: The number of users who successfully activate their account.
- Logins: The number of users who successfully logged in.
- Drop-offs: The number of users who started the process but did not complete it.
To filter the information shown on the chart, select the checkbox corresponding to the information you want to display. For example, if you prefer to display only registrations and registration drop-offs, select the registrations checkbox.
By default, the drop-offs checkbox is selected. If you prefer not to display drop-offs, deselect the drop-offs checkbox.
API usage
This chart shows the number of times an API endpoint was called during the selected time period (Learn more about the filters for this page). Select or hover over any of the API endpoint columns to display a more precise value for that API endpoint's usage count.
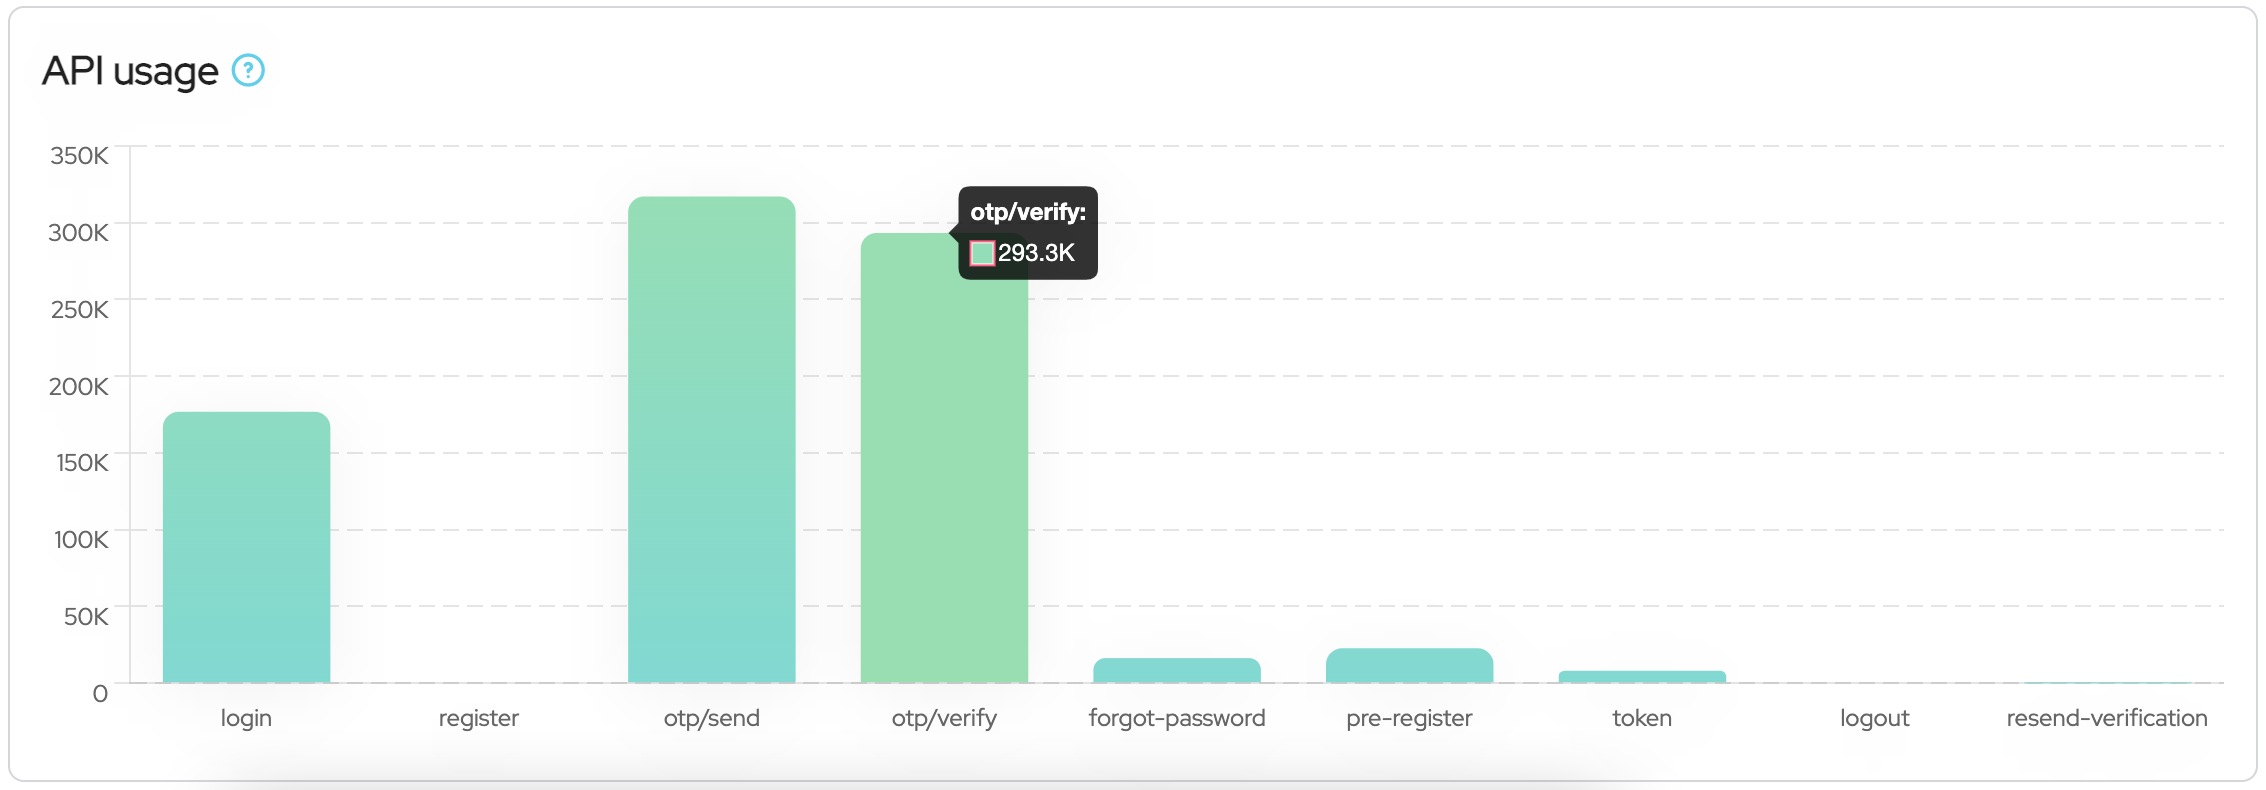
Summary of API Endpoint Usage.
Available Filters
Initially, the Engagement page shows data for all properties in your organization from the past 30 days and in the Production environment. However, you can narrow the results by choosing specific filters such as Environment, Properties, and Time Period.
Environment
To view data from a different environment than the default (Production), please follow these steps:
- Choose the Environment filter. The options will appear.
- Select the environment to display from the dropdown.
- Once you select it, the information on the screen will be updated accordingly.
Properties
As mentioned earlier, the Engagement page shows data for all properties in your organization by default. If you want to view data for specific properties, follow these steps:
- Click on Filters. The Properties dropdown menu appears.
- Select the property to display from the dropdown. Select the checkboxes of your preferred properties to filter information for multiple properties.
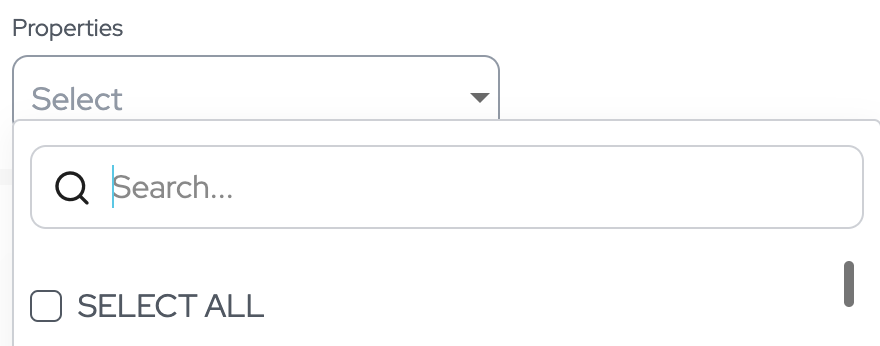
Properties Filter
- Select Apply to display data for the chosen property only.
Time Period
As previously stated, the Engagement page displays data for the past 30 days as the default setting. However, if you wish to view data for different time periods, such as the past week, past month, or a custom range, please follow these instructions:
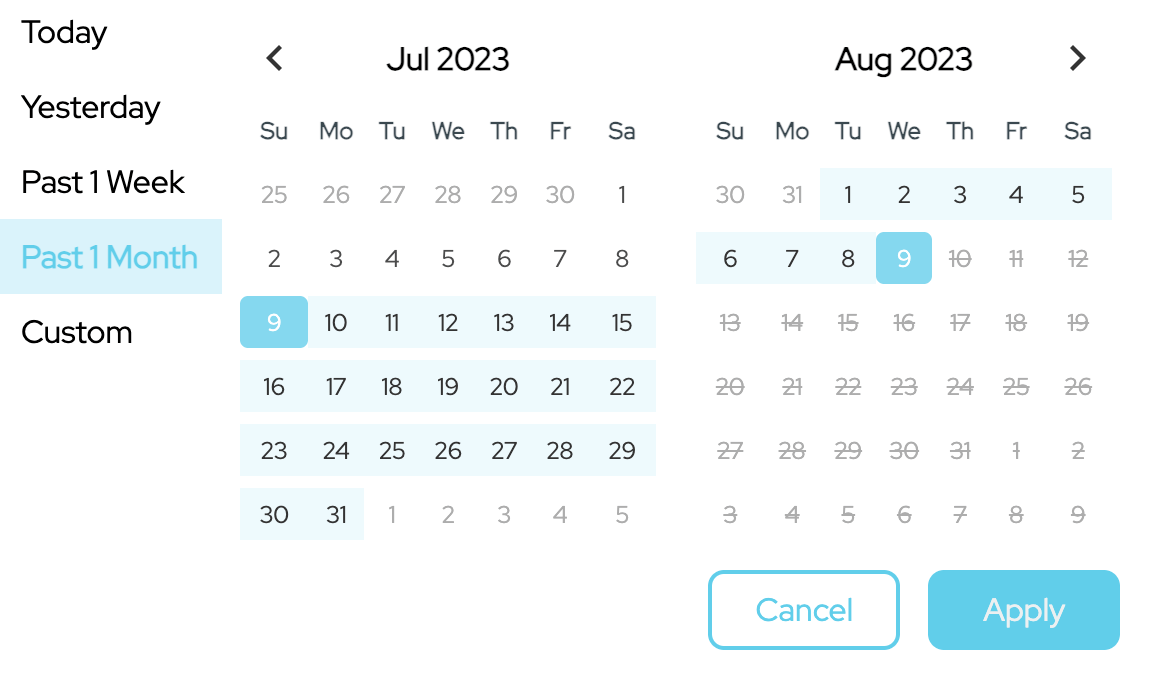
Time Period Filter
Please note the following time period details.
For this example, we assume the current day is January 2, 2022:
- Today (Whole day from January 2, 12:00 AM - 11:59 PM)
- Yesterday (Whole day of the previous day from January 1, 12:00 AM - 11:59 PM)
- Past 1 Week (Covering eight days a week, including today's date)
- Past 1 Month (Covering third days, including today's date)
To set a custom period of time, select the start date on the calendar and then choose the end date. To confirm your selection, select Apply.
To disregard your selection, choose Cancel.
The information on the page will be updated based on the selected period.
Updated 9 months ago