
Feature Adoption Insights
Discover the adoption rates and usage details of various features within your organization.
Gain insights into feature adoption rates and usage details within your organization through the Feature Adoption page on Next Identity Analyze. Navigate to the Analyze section on the left-hand menu and select Feature Adoption to view how your clients use various features. Understanding these rates is crucial to strategic decisions on feature development and client engagement.
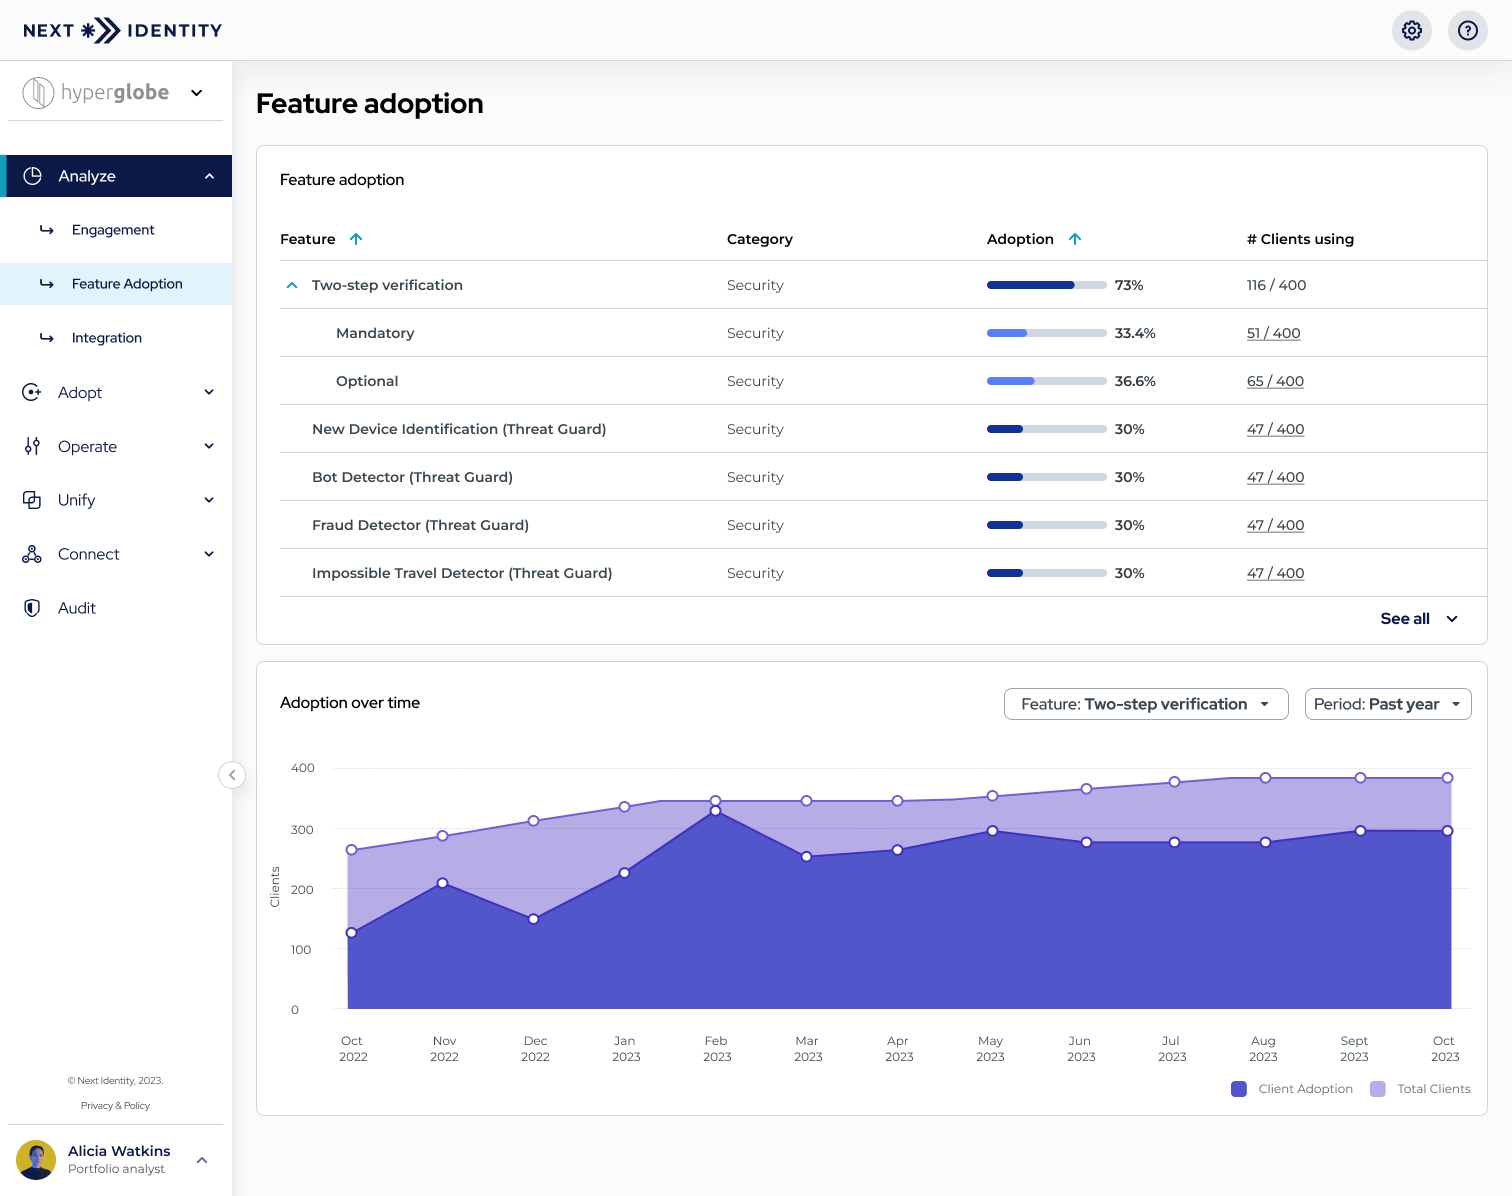
Feature adoption screen
Understanding Feature Adoption Rates
To understand how often a feature is used, we need to calculate its Feature Adoption Rate (FAR). This metric compares the number of clients who use a feature to the total number of clients who could potentially use it. FAR is important because it helps us evaluate the popularity and effectiveness of each feature.
It's important to note that when calculating the FAR for all features, we exclude M2M clients.
| Feature | Category | FAR Calculation |
|---|---|---|
| Biometric Authentication | Authentication | FAR is determined by the proportion of clients who have enabled biometric authentication in their operational environments. For instance, if 70 out of 100 possible clients have enabled biometric authentication, the FAR would be 70%. |
| Bot Detector (Threat Guard) | Security | FAR is determined by the number of clients in production and operational environments with Bot detection turned on. |
| Federated Groups | Experience enhancements | FAR is determined by the proportion of clients in production and operational environments with Federated Group functionality enabled. |
| Google reCAPTCHA | Security | FAR is calculated for clients in production environments with operational status who have Google reCAPTCHA enabled. This reflects the adoption among a targeted client base. |
| Honeypot | Security | FAR is determined by the number of non-M2M clients in production and operational environments that have implemented the Honeypot security system. |
| Impossible Travel Detector (Threat Guard) | Security | FAR is calculated by identifying clients in production and operational environments who use the Impossible Travel identification feature. |
| New Device Detector (Threat Guard) | Security | FAR is assessed by the number of clients in production and operational environments with the New Device identification feature turned on. |
| One-time Password | Authentication | FAR is assessed by counting clients in production environments with operational status who use the One-time Password as their authentication method. |
| Password Breach and Strength | Security | FAR is determined by the proportion of clients in production and operational environments with the Password Breach and Strength feature turned on. |
| Password History | Security | FAR is calculated based on the number of clients in production and operational environments who utilize the Password History feature. |
| Progressive Profiling | Experience enhancements | FAR is calculated by assessing the number of clients in production and operational environments with Progressive Profiling turned on. |
| Risk Detector (Threat Guard) | Security | FAR is calculated based on clients in production and operational environments who use Fraud Score analysis for threat prevention. |
| Two-step Verification (Mandatory and Optional) | Security | FAR is calculated separately for each category, considering clients implementing the respective option. The overall FAR for Two-step Verification combines these individual rates to provide a comprehensive view. |
| Voice One-time Password | Authentication | This FAR is calculated by identifying clients with Voice One-time Password enabled in production and operational environments. |
These insights help identify trends, understand client preferences, and make informed decisions about future feature enhancements.
Adoption Rates
The Adoption rates section offers a detailed breakdown of feature usage:
- Feature: Lists the name or details of the feature.
- Adoption: Shows a visual chart along with the adoption rate percentage.
- Clients: Indicates the number of clients utilizing the feature against the total number eligible to use it.
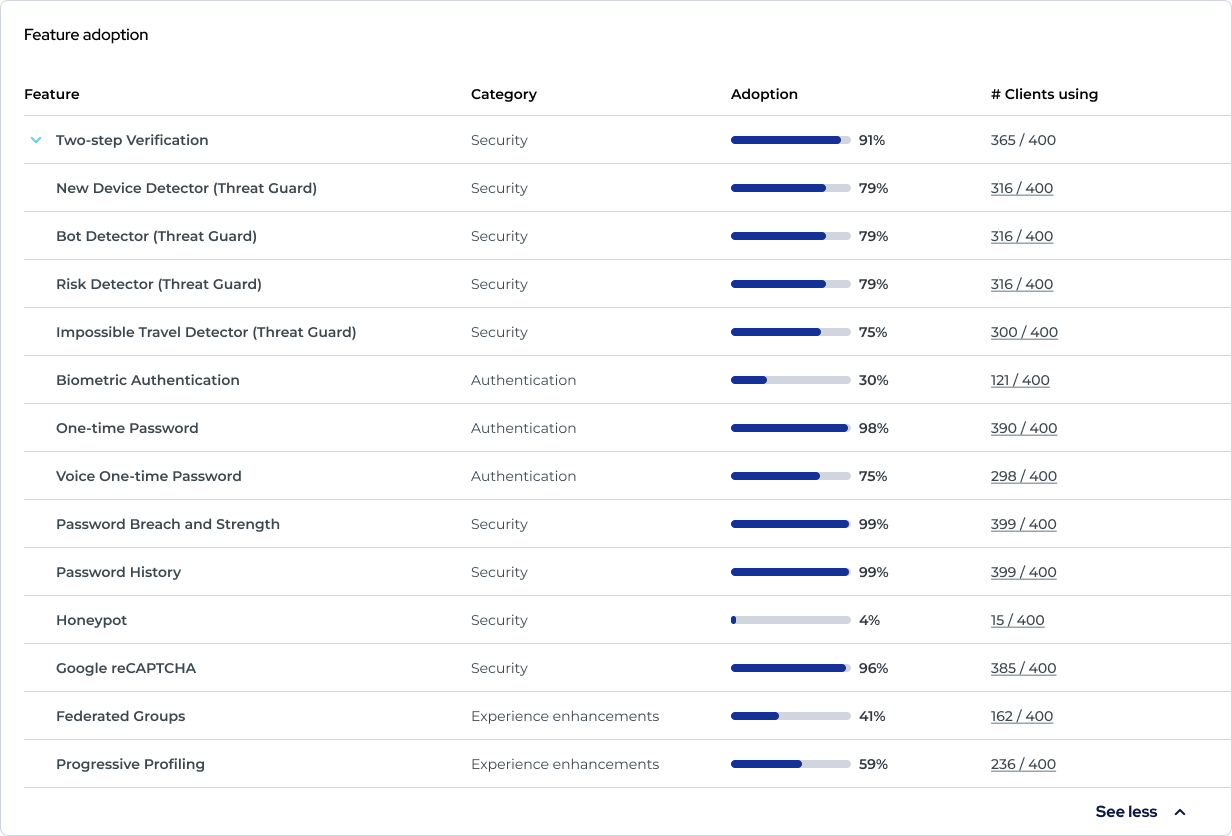
Adoption rate section
The adoption rate sorts the list, first highlighting the most widely adopted features.
Feature Usage by Client Segment
An essential aspect of comprehending feature adoption is to analyze specific client usage data. This is made possible through the Feature Adoption page by allowing direct interaction with the presented data.
- Navigating to Client-Specific Data: In the adoption rates section, the number of clients using it accompanies each feature. By selecting these client counts for a desired feature, you are seamlessly taken to the Properties List screen.
- Automatic Filtering: On the Properties List screen, filters are automatically applied to display only those operational clients using the feature in their production environment. This feature provides a focused view, enabling you to analyze the adoption rate more granularly.
- Insightful Analysis: This functionality is crucial for understanding how specific features are adopted across different client segments. It allows for a targeted analysis, which can be instrumental in shaping future feature enhancements or marketing strategies.
Adoption Over Time
The Feature Adoption page includes a chart that visualizes feature adoption over time compared to the total client base. This provides valuable insights into feature adoption dynamics and aids in tracking changes and trends.
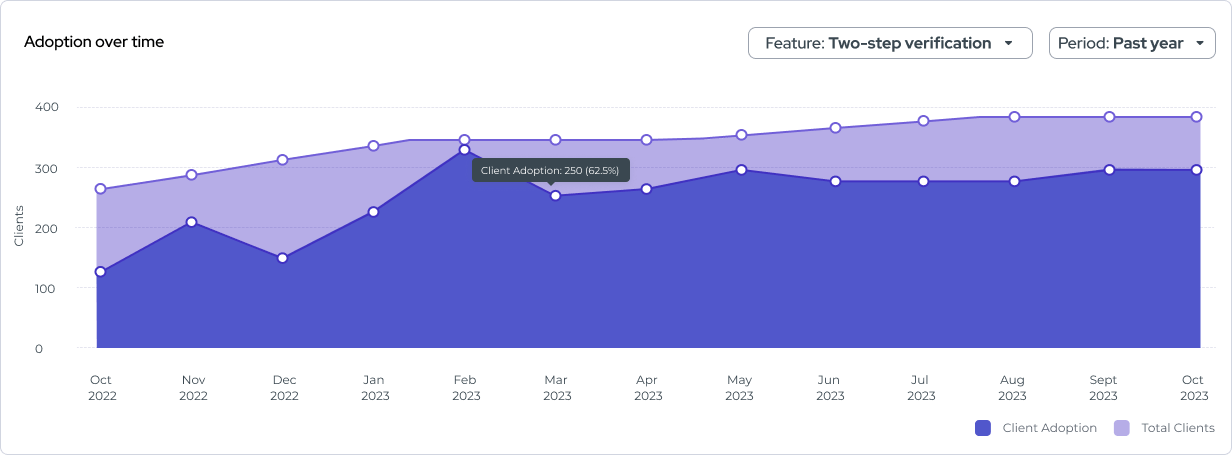
Adoption Over Time Chart
Overview of Adoption Over Time
- Visualization: This chart displays two series - "Adopted Clients" and "Total Clients", showing the relationship between the active and potential client usage of features over time.
- Filtering Options: Users can filter by feature and period.
- Date Intervals: The x-axis denotes time, with intervals set according to established product standards for uniformity in analytics.
- Interactivity: When users hover over data points, detailed adoption percentages are revealed, providing a deeper understanding of feature usage over time.
Roles & Permissions
User permissions determine the access to the "Feature Adoption" feature. Collaborate with your Next Identity consultant to specify who can view the data displayed on this screen. For further details, please reach out to your Next Identity consultant.
Frequently Asked Questions (FAQs)
Q: How is the Feature Adoption Rate calculated?
A: The Feature Adoption Rate (FAR) is calculated by dividing the number of clients actively using a feature by the total number of clients that could potentially use it. This rate helps in understanding the popularity and effectiveness of each feature.
Q: Can I view feature adoption data for specific client segments?
A: Yes, you can filter the feature adoption data to view specific client segments. This allows for a more targeted analysis of feature adoption trends within particular groups of clients.
Q: What should I do if I notice low adoption rates for a feature?
A: Low adoption rates can be an indicator for potential improvements. Gathering client feedback, analyzing usage patterns, and considering enhancements or additional training to increase adoption is advisable.
Q: Are there any restrictions on accessing the Feature Adoption page?
A: Access to the Feature Adoption page is limited to users with specific roles. This ensures that sensitive data is only accessible to authorized personnel. For further details, please reach out to your Next Identity consultant.
Updated 9 months ago