
Next Identity Platform Status Page
Empowering Your Decision-Making with Real-Time Performance Insights
The Next Identity Platform Status page provides real-time, comprehensive insights into the status and performance of the Next Identity services. This guide will walk you through how to make the most of this crucial tool.
Exploring the Next Identity Platform Status Page
Accessing the Status Page
The Next Identity Platform Status Page is your go-to source for real-time and historical data on the system's performance. To access it:
- Open a web browser of your choice.
- Enter the URL for the status page: https://status.nextidentity.io/
- The landing page provides you with an immediate overview of the system status. The main sections you will see are:
- Gateway: Shows the status of the main access point for all Next Identity services.
- Applications: Provides individual status updates for Journeys and Console services.
- APIs: Reports the status of various APIs like Unify API, Connect SMS API, User API, and Adopt API.
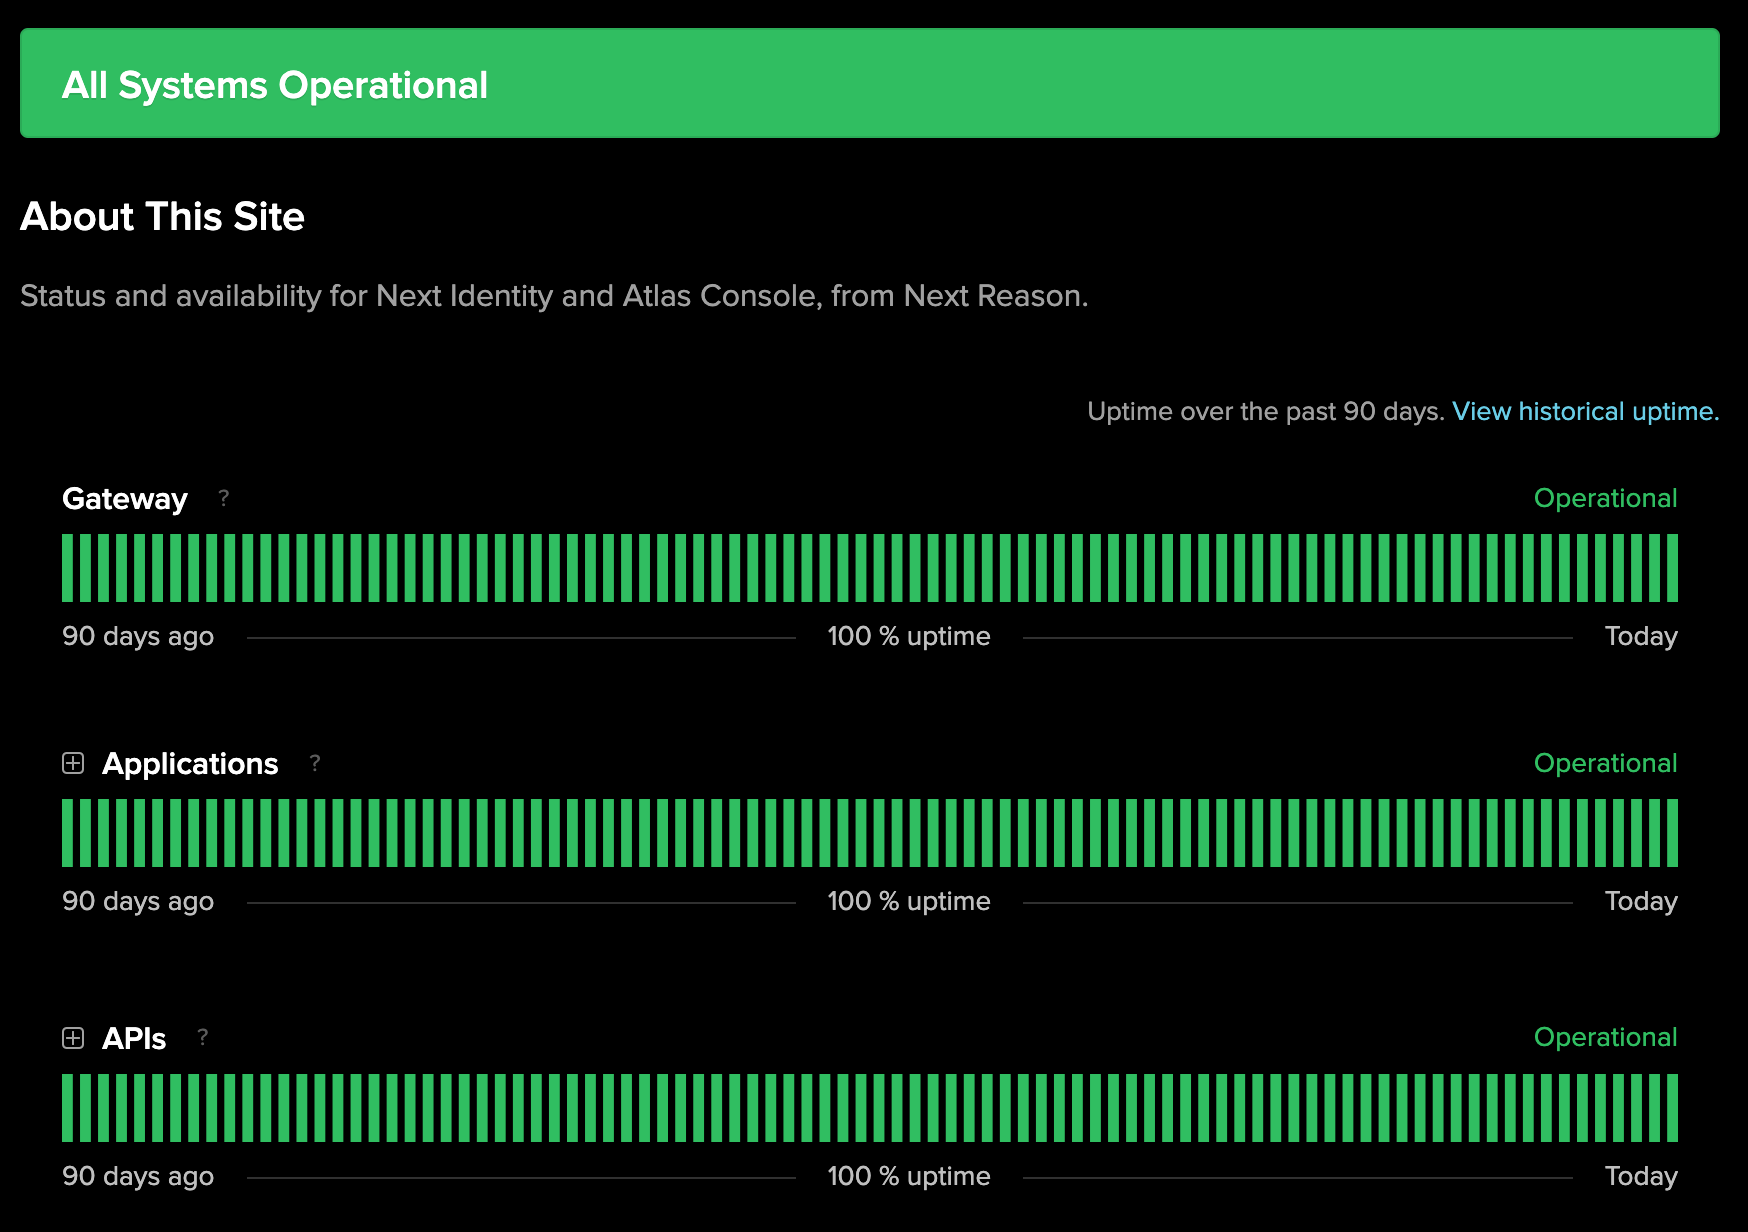
The Next Identity Platform Status Page showcasing real-time service status.
- Underneath each section, you can view system metrics like Response Time and p99 Latency for various services.
Status Indicators Explained
When looking at the Next Identity Platform Status Page, you'll notice different status indicators for various services. Here's what each status means:
- Operational: Indicated by green color, the service is fully operational with no known issues.
- Under Maintenance: Recognizable by the color blue, the service is currently under scheduled maintenance.
- Degraded Performance: Shown in yellow, the service is operational but might be experiencing minor issues causing reduced performance.
- Partial Outage: Displayed in orange, parts of the service may be down leading to a partial service outage.
- Major Outage: Signified by red, the service is experiencing significant issues and is not operating optimally.
It's important to check the status page regularly, as it will provide you with the most accurate, up-to-date information on the performance and availability of your services.
Unleashing the Power of Metrics
To understand your service's performance and health, two key metrics on the Next Identity Platform Status page are crucial: Response Time and p99 Latency.
Metrics Uncovered
Response Time
Response Time is the measure of time it takes for a system to respond to a request. Whether it's a user attempting to log in, retrieve data, or perform any operation, the Response Time signifies how swiftly the service completes the request. Measured in milliseconds, a lower Response Time indicates a faster, more efficient service - a critical component in ensuring a seamless experience for your users.
p99 Latency
p99 Latency is a statistical measure that provides a deeper understanding of your system's performance. When we talk about p99 Latency, we're saying that 99% of all requests to the service are processed within this time frame. It helps in identifying outliers in performance, as only 1% of the requests take longer than the p99 Latency. By monitoring p99 Latency, you can ensure consistent service delivery, as it allows you to detect and address potential issues that affect a small subset of requests.
Reading the Metrics
Understanding these metrics is not just about knowing their definitions. It's equally important to interpret them correctly to make data-driven decisions.
Interpreting Response Time
A Response Time graph gives you a visual representation of how your service's responsiveness varies over time. Lower values on the graph indicate faster responses, while higher values suggest the service is taking longer to respond to requests. A sudden spike might signify an issue needing attention. Regular monitoring can help identify patterns and react proactively to performance trends.
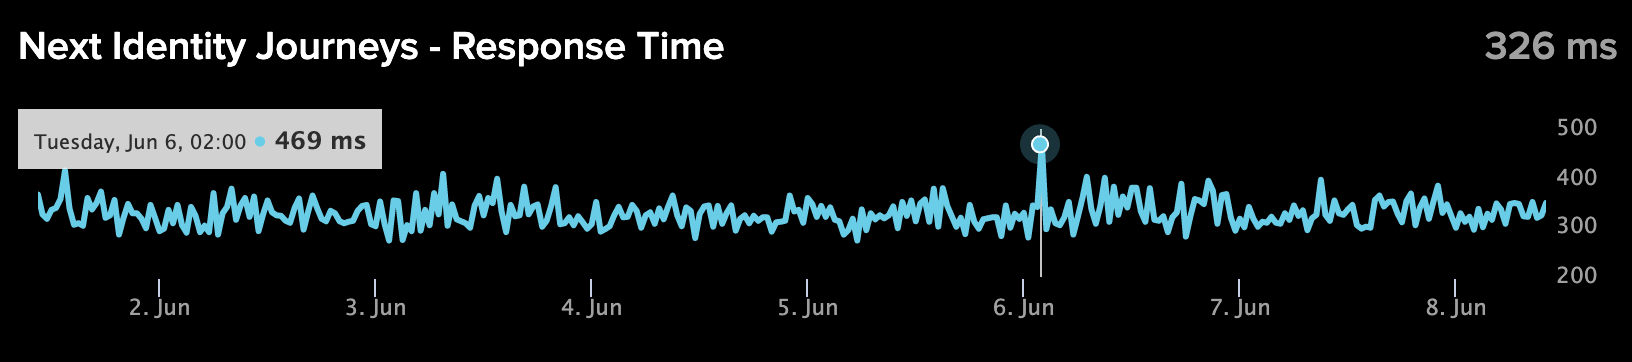
Response Time graph with a spike. This increase may suggest a potential issue requiring attention.
Understanding p99 Latency
The p99 Latency graph might have higher values than the Response Time graph because it's capturing the longest response times for the 1% of requests. Consistently high p99 Latency could indicate a problem with a specific aspect of the service affecting a small number of requests. Sudden spikes, especially if they're not matched by similar spikes in the Response Time graph, could point to issues that are affecting only a small subset of users. By keeping a close eye on these metrics, you can help ensure a high-quality experience for all your users.
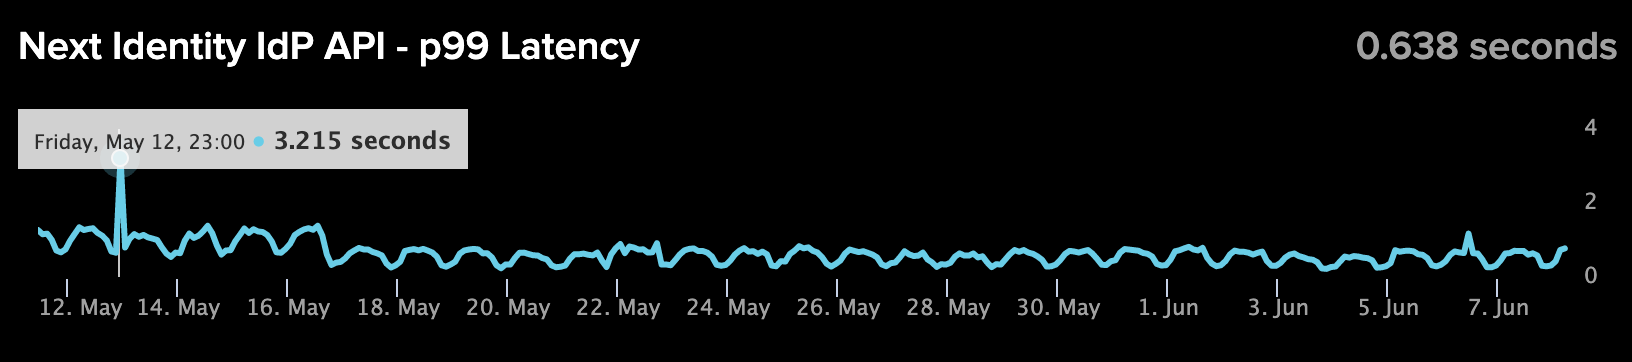
Latency graph illustrating a spike. This could indicate an issue affecting a small subset of users.
Staying Ahead with Alerts and Notifications
Stay proactive, not reactive, with real-time alerts and notifications on your service's performance.
The Power of Alerts
Alerts serve as your early warning system, notifying you of any changes in the performance or status of your services. They allow you to quickly identify and resolve issues, minimizing any potential impact on your users. For instance, a maintenance alert (see the following image) gives you advance notice of any planned downtime, helping you plan accordingly. By keeping you apprised of the health of your services, alerts play an integral role in upholding service excellence.
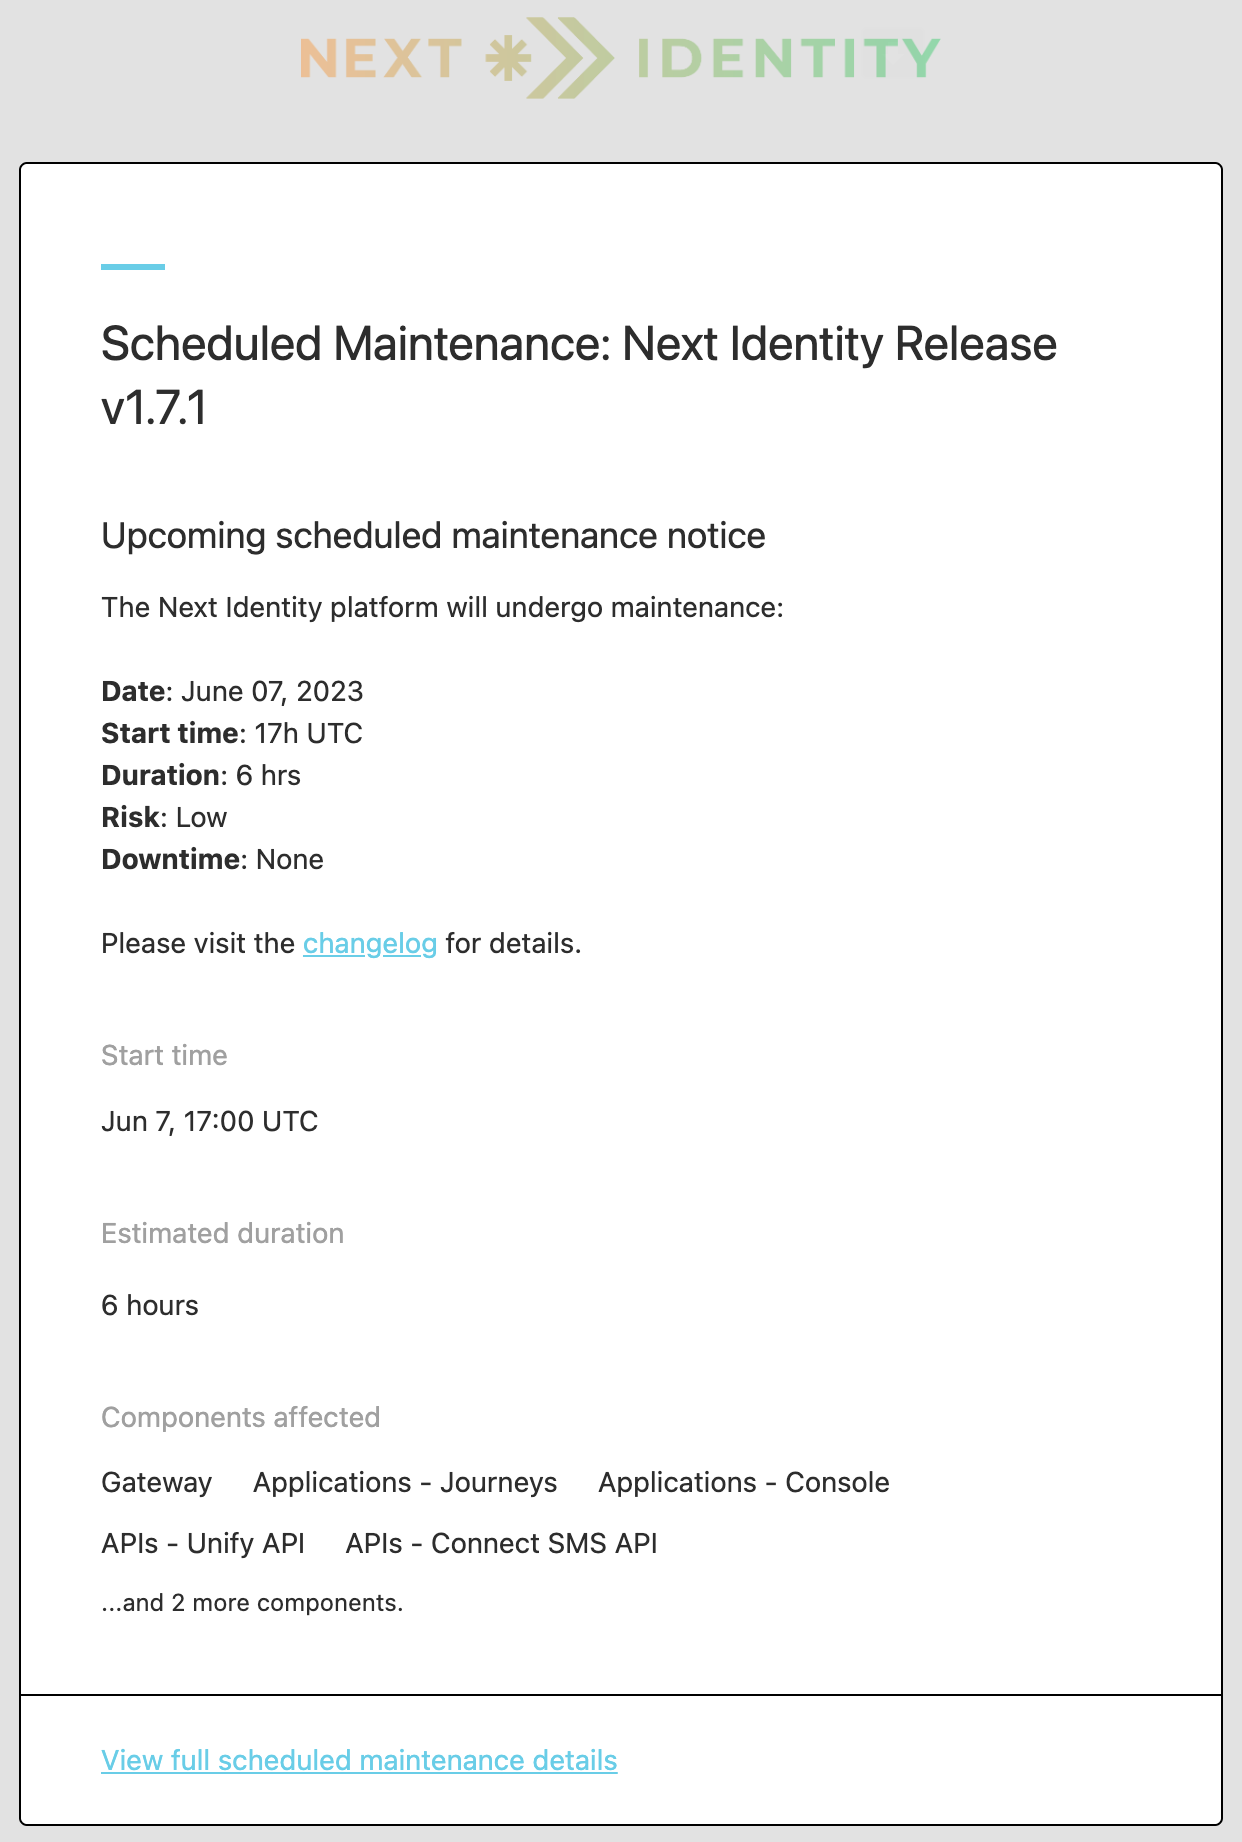
An example of a Scheduled Maintenance alert email notification for the Next Identity Platform.
Setting Up Notifications
To ensure you're always informed about your services' status, setting up notifications is a key step:
- Navigate to the Next Identity Platform Status Page.
- Click on "Subscribe to Updates".
- Choose your preferred method of receiving updates: Email, SMS, Webhook, etc.
- Follow the prompts to complete the setup.
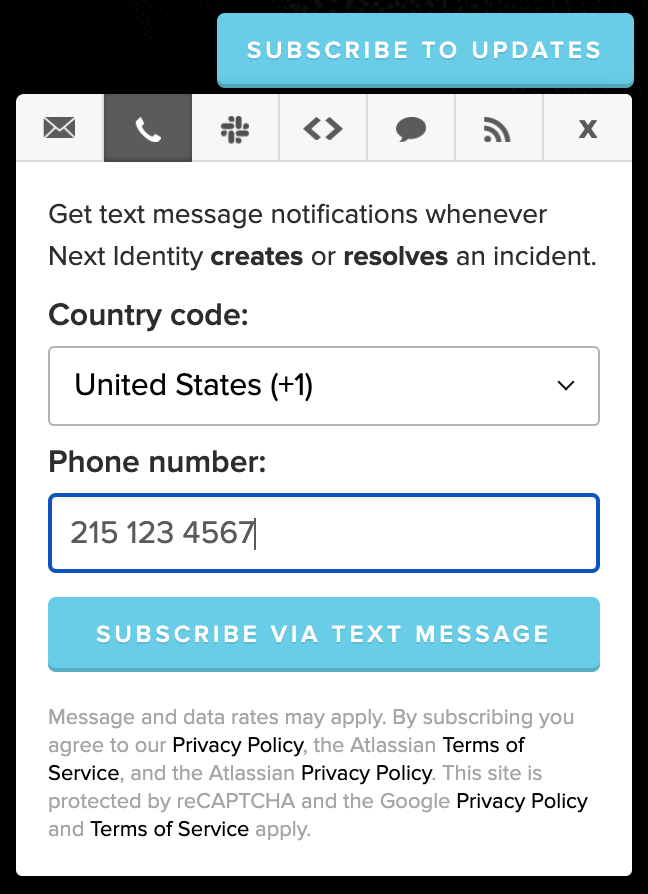
Setting up notifications on the Next Identity Platform Status page.
Best Practices and Recommendations
For Service Administrators
- Monitor Regularly: Check the status page daily to understand the health and performance of your services.
- Understand the Metrics: Familiarize yourself with Response Time and p99 Latency to interpret service performance accurately.
- Set Up Alerts: Ensure you're subscribed to receive alerts for immediate notifications on service performance.
For Application Teams
- Integrate Status Page: Incorporate the status page into your routine checks to maintain a comprehensive view of your services.
- Use Alerts to Stay Ahead: Utilize alerts for real-time updates and to preemptively tackle any potential issues.
- Understand Your Metrics: Know what Response Time and p99 Latency mean for your specific application to interpret them correctly.
Updated 9 months ago